
Do you program in R and normally use DPLYR for data wrangling, manipulation or whatever term you call it? Have you heard all the hype about data.table and how this package can significantly improve the performance run time of your R scripts? Have you been meaning to get round to learning data.table and have never managed it? The answer to these questions is that you don’t have to. This is exactly the purpose of the DTPLYR package.
Loading in DTPLYR
To load the package we are going to bring in some of the libraries we will need to work with:
1 2 3 4 5 | #install.packages("dtplyr") library(data.table) library(dtplyr) library(dplyr, warn.conflicts = FALSE) library(NHSRdatasets) |
Here I bring in the dtplyr package alongside data.table, dplyr and NHSRdatasets. The major benefit of data.table over dplyr is that it loads larger datasets much quicker.
Generating a large dataset to work with
The next step is to use the stranded_data data from the NHSRdatasets package. This is a set of patients who have been in hospital, as an inpatient, longer than 7 days.
The following lines load in the data and then create duplicates of the data frame. I have added a system.time() wrapper here to see how long the code takes to run:
1 2 3 4 5 6 7 | #Save the data to a data frame called df df <- NHSRdatasets::stranded_data #Create another 100,500 copies of the original data system.time( df <- df[rep(seq_len(nrow(df)), each = 100500), ] ##TAKES A WHILE TO LOAD ) |
Create a lazy data table
Now, we are going to use dtplyr to create a lazy data table. It is lazy, because you don’t need to know anything about the data.table package to convert it to this type, which under the hood is essentially a data.frame class.
1 2 | # Create a lazy data table strand_dt_lazy <- lazy_dt(df) |
DPLYR filtering on data.table object
The next step is to do some custom filtering on our new lazy data table object:
1 2 3 4 | strand_dt_lazy %>% filter(care.home.referral == 1) %>% group_by(stranded.label) %>% summarise(mean_age = mean(age)) |
Here two things happen. You get:
- The converted data.table code in the first print to the console:
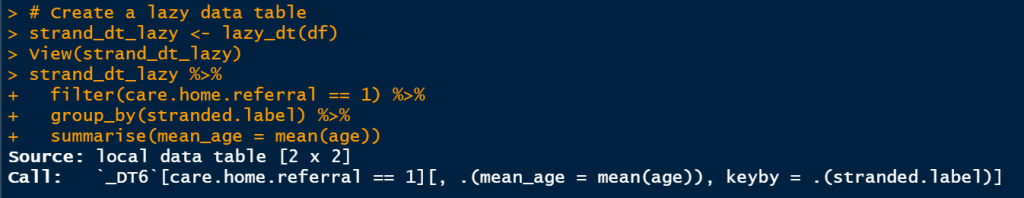
2. The results of the filtering operation:
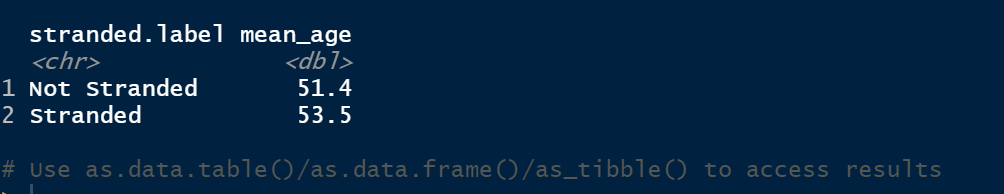
At the bottom it says use the as.data.table, as.data.frame or as_tibble commands to store these results. This is what I will do in the next step, but on a subset of the whole data.
Access our dtplyr results in a tibble
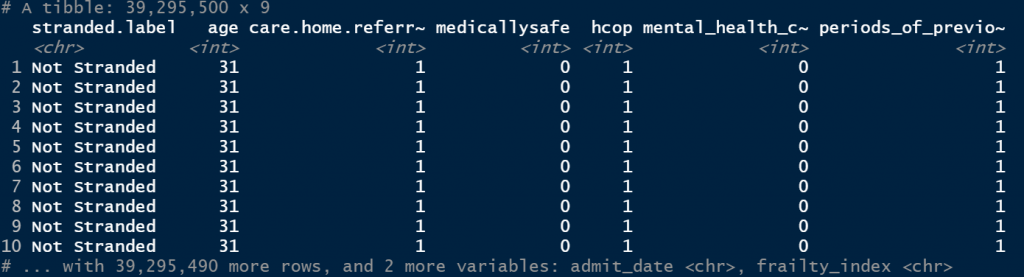
As indicated in the last print, we now need to access the results as a tibble. The code below is how to use this, essentially at the end of your filter, just add another pipe and make sure you cast it to the relevant data frame object i.e. tibble, data.frame or data.table:
1 2 3 4 5 | # To convert to tibble, use as_tibble at the end of the code strand_dt_lazy %>% filter(care.home.referral == 1) %>% group_by(stranded.label) %>% as_tibble() |
The results are outputted in super lightning speed:
Wrapping up
This was just a short blog to highlight the usefulness of dtplyr and show how it can be used to convert dplyr code to data.table syntax, and also how it builds data.table syntax behind the scenes.
If you want to learn data.table – check out my other post on this: https://hutsons-hacks.info/data-table-everything-you-need-to-know-to-get-you-started-in-r.