Asif Laldin was the main developer of this package, but I contributed a few functions and offered overall package development advice. This is a great effort and is crammed full of functions for working with population health datasets, standardised rates, standard visuals, etc. It contains a smorgasbord of delightful functions to wet any R developers appetite.
About the package
SangerTools was born out of necessity.
It is the formal aggregation of a set of coding solutions employed regularly to carry out Population Health Management Analytics; rapidly and consistently. It has has been created specifically for Gloucestershire CCG and wider National Health Service (NHS) staff working with patient level population health data.
However, we hope Sanger Tools aids analytical workers around to world who work with similar datasets.
Currently this will be best suited to CCG and CSU staff.
If you are using this package outside of the NHS we would be very keen to hear from you!
The package draws its name from Sanger House; the office in which NHS Gloucestershire CCG’s analytical team are based.
Package aims
The tools in this package have been created to assist in every-day tasks undertaken by most NHS analysts. Functions have been created to provide an easy-to-use interface for common tasks where analysts are working between R, SQL and Excel. Many of the functions are created to work with datasets which contain 1 Row Per Patient in tidy data format; where each row is an observation and columns are variables pertaining to the patient. This format is commonly seen across the NHS; often referred to as Master Patient Index (MPI).
Show me the functions
This package contains:
- Population Health data – this is useful for testing the functions in the package on samples of what you would typically see from NHS population health data, as well as other population health datasets
- Age banding – namely age_bandizer using a tidyverse philosophy using non standard evaluation. It produces a new column with 5 year age bandings as a factor. Also, an additional function age_bandizer2 and allows the customisation of banding sizes for a specified interval i.e. 2,5,10 or 20.
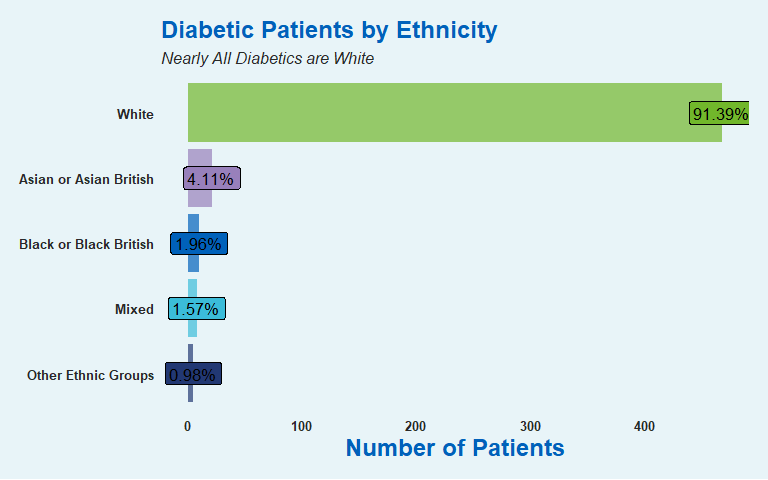
- Categorical column charting – the charts below can be easily generated by this function:
- Crude prevalence – can be generated by the crude_rates function and it will give you the crude prevalence per 1000 of the population
- Handy functions such as multiple_csv_reader to read multiple CSVs at once, split_and_save to split your dataframes up and save the outputs, excel_clip to save the data to the clipboard using an R function and results_to_sql which allows you to save the results to a SQL server table and database of your choosing. The tool also comes with handy custom palettes to use in your charts.
Learn how to use the package
To learn how to use the package, refer to the supporting vignette.
For issues and to refer to the supporting GitHub click these links.
Closing remarks
This is a great package and it was nice for me to be able to pass my knowledge of package development on to someone else. I felt like a small shrivelled Star Wars character by the end.