
The ConfusionTableR package has a new function. Welcome to var_impeR which takes a trained caret R model and produces a tibble and a supporting variable importance plot.
How to use the new var_impeR function
The code following shows how to use the new function:
Training a CARET model
The following steps were used on the NHSRDatasets package to train a machine learning model on our dataset:
1 2 3 4 5 6 7 8 9 10 11 12 13 14 15 16 17 18 19 20 21 22 23 24 25 26 27 28 29 30 31 32 33 | library(magrittr) library(dplyr) library(caret) library(tibble) library(ggplot2) library(forcats) library(NHSRdatasets) #Load in stranded dataset from NHSRDatasets strand <- NHSRdatasets::stranded_data %>% na.omit() %>% select(-c('frailty_index', 'admit_date')) %>% mutate(stranded_class = make.names(as.factor(stranded.label))) %>% select(-stranded.label) dataset <- strand # Perform a simple test / train split on the data train_split_idx <- caret::createDataPartition(dataset$stranded_class, p = 0.75, list = FALSE) data_TRAIN <- dataset[train_split_idx, ] data_TEST <- dataset[-train_split_idx, ] dim(data_TRAIN) dim(data_TEST) # Set the model metrics to accuracy and train a random forest model eval_metric <- "Accuracy" set.seed(123) # Random seed to make the results reproducible rf_mod <- caret::train(stranded_class ~ ., data = data_TRAIN, method = "rf", metric = eval_metric) |
The code:
- Loads in the NHSRDatasets stranded_data ML classification set
- Splits the ML model by a training and test split
- Monitors the model accuracy
- Train a random forest model on our classification data
Time for the Variable Importance with the var_impeR function
Now, once we have the model trained we simply pass the model through the var_impeR function, available in the ConfusionTableR package:
1 2 3 4 5 6 | # install.packages("remotes") # if not already installed remotes::install_github("https://github.com/StatsGary/ConfusionTableR") library(ConfusionTableR) # Use the function ConfusionTableR::var_impeR(rf_mod) |
The resultant output is hereunder:
Variable Importance Tibble
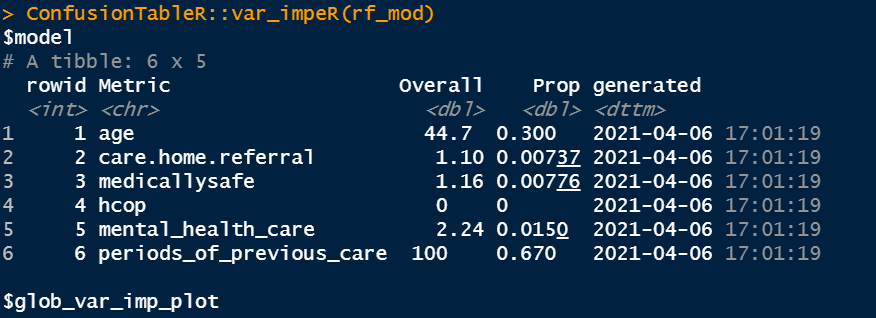
This shows how strong the model metrics are against whether a person is a stranded patient.
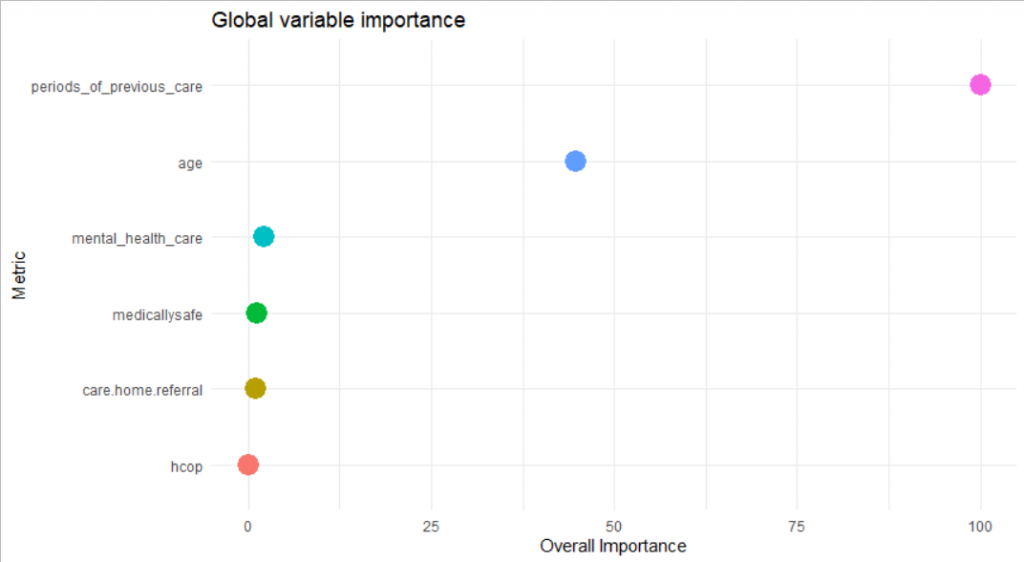
Variable Importance Plot
The variable importance plot is as below:
Conclusion
To learn more about the ConfusionTableR package – see the vignette to help with flattening confusion matrix table outputs ready for importing into databases.