
I have recently uploaded my first R package to the CRAN repository, it needs an additional revision, but it is now there. I wanted to know how many downloads it has had since its release on CRAN last month. I thought shall I write a package, but alas there is one already available.
The dlstats package saves the day
I was searching on the old Google and I found this lovely package that does just what I need. I have created a small tutorial to show you how to build the small routine needed to monitor your downloads.
Starting with the libraries needed
The first step was to start with the libraries I needed to work with:
1 2 3 | library(ggplot) #install.packages("dlstats") library(dlstats) |
Using the cran_stats command in dlstats
The next thing to do was to pass a vector of packages I wanted to see the downloads over time. I thought it would be a nice use case to see what R Machine Learning packages are being downloaded, as I have an affinity to caret, as I have been using it for a number of years (4+) as a ML modeller and Senior Data Scientist.
To utlise the command I created a pack_status variable and passed in a vector of values:
1 2 3 4 5 6 7 8 9 10 11 | packages <- c("caret", "tidymodels", "parsnip") pack_status <- cran_stats(packages) #View the head of the data frame head(pack_status) # start end downloads package #1 2018-07-01 2018-07-31 31 tidymodels #2 2018-08-01 2018-08-31 734 tidymodels #3 2018-09-01 2018-09-30 1087 tidymodels #4 2018-10-01 2018-10-31 4496 tidymodels #5 2018-11-01 2018-11-30 1302 tidymodels #7 2018-12-01 2018-12-31 1250 tidymodels |
This retrieves the information I need to a data frame for inspection. Now I will produce a visualisation to visualise the downloads.
Creating a visualisation
The next step was to create the visualisation:
1 2 3 4 5 6 7 8 9 | if (!is.null(pack_status)){ head(pack_status) plot <- ggplot(pack_status, aes(end, downloads, group=package)) + geom_line(aes(color=package),linetype="dashed") + geom_point(aes(shape=package, color=package)) + theme_minimal() plot <- plot + xlab("Download date") + ylab("Number of downloads") print(plot) } |
This produces the download plot for the packages.
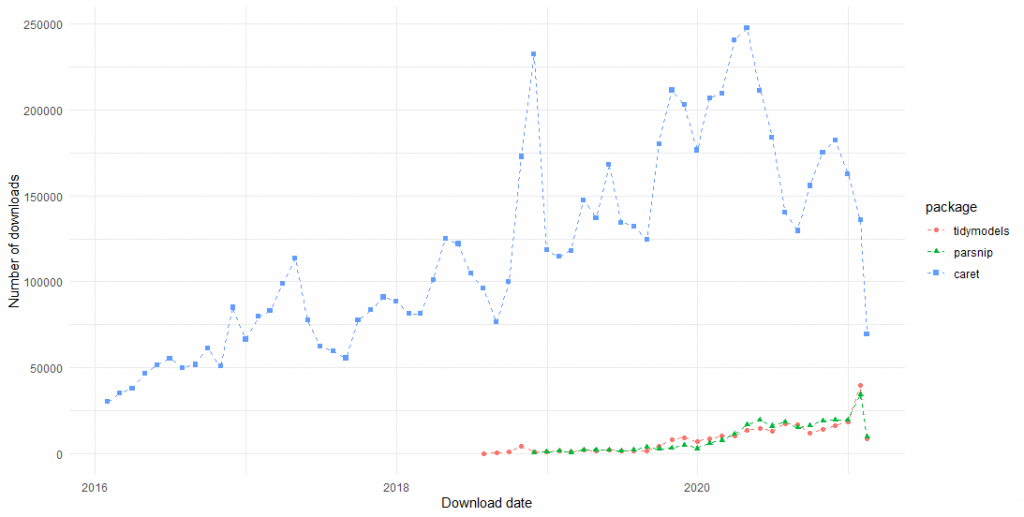
This is a great way to visualise the popularity of a package and as you can see caret still remains strong. Even with its decline this year compare to the increases in parsnip, it is still downloaded many more times than the tidy versions of the package.
Viewing the NHSDataDictionaRy package in R
Now, I will pass my package to the variable NHSDataDictionaRy to see how many times this has been downloaded. This has not been launched in the NHS, so I expect to see it rise. The full worked code is below:
1 2 3 4 5 6 7 8 9 10 11 12 13 14 15 16 17 18 19 20 21 | library(ggplot2) library(dlstats) library(tibble) packages <- c("NHSDataDictionaRy") pack_status <- cran_stats(packages) #View the head of the data frame head(pack_status) if (!is.null(pack_status)){ head(pack_status) plot <- ggplot(pack_status, aes(end, downloads, group=package)) + geom_line(aes(color=package),linetype="dashed") + geom_point(aes(shape=package, color=package)) + theme_minimal() plot <- plot + xlab("Download date") + ylab("Number of downloads") print(plot) } print(plot) |
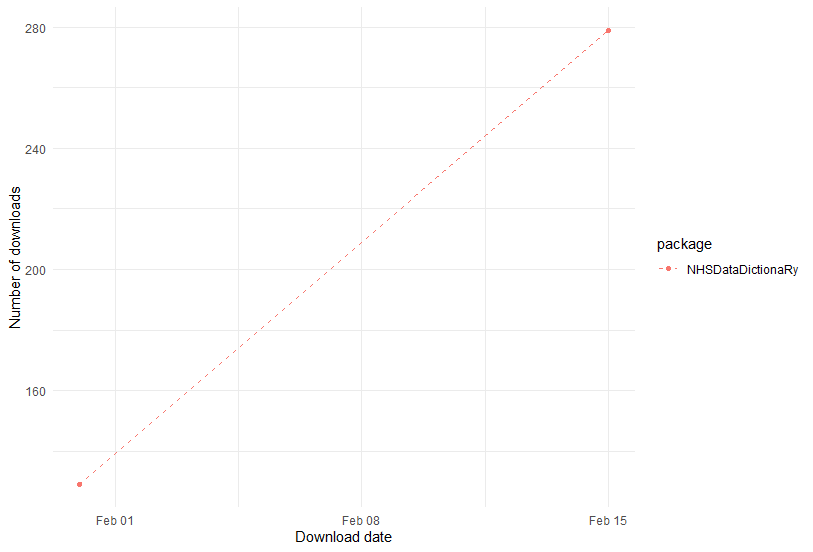
The output, as expected, is an increase, which is good news, but this package has not yet been formally launched, as stated prior:
Storing the returns as a list
The last step of the code is to store the plot, returned data frame and total sum of downloads as a list:
1 2 3 4 5 6 7 8 9 10 11 12 13 14 15 16 | package_list <- list("package_dl_plot"= plot, "download_df"=as_tibble(pack_status), "downloads_to_date"=sum(pack_status$downloads)) package_list$download_df ## A tibble: 2 x 4 # start end downloads package # <date> <date> <int> <fct> # 1 2021-01-01 2021-01-31 129 NHSDataDictionaRy # 2 2021-02-01 2021-02-15 279 NHSDataDictionaRy package_list$package_dl_plot #Access the plot package_list$downloads_to_date #[1] 408 |
Outputs are:
- A list of:
- Tibble with downloads by date (month)
- A stored plot object in the list
- A summary of the total downloads to date
Wrapping up
The code for this tutorial can be found on my GitHub site.
I hope you found this useful and can find a use for it when investigating the downloads for your package, or to compare package popularity.