
Fun with 
I was recently looking for a way to style up my existing plots and allow them to be interrogated by a user with the added functionality that the package plotly is installed.
This package contains a wealth of functionality for creating charts into plotly charts and their website is a great source to get started: https://plot.ly/r/.
This takes some learning, and has a different syntactical style and make up, than working with ggplot2. In saying that, the link above has lots of tools to get you started with creating charts directly with the plotly syntax.
What is brilliant about this and the reason for the blog post is that you can convert any ggplot2 chart into a plotly chart. The following example shows a ggplot2 chart that is created from random data.
Getting started with the conversion
First start by installing the relevant packages needed for this conversion:
#install.packages("plotly")
library(plotly)
library(tidyverse)
Once these are installed we will manufacture a test data set to use for the conversion. Creating the test data set:
x <- rnorm(100,10,20)
y <- runif(100,1,50)
type1 <- c("New appointment", "Follow up appointment")
random_tag <- rep(type1,50)
df <- tibble(x,y,random_tag) df %>% summary()
#Get a quick summary
This creates a random dataset of 100 data points from a random normal distribution for the x axis and a random uniform distribution for the y axis. I then create my types of appointments – these relate to outpatients and then I use the rep function to replicate the test 50 times per item in the vector, this will assign 50 to new appointment and 50 to follow up appointment. I then create a data using a tibble, or a traditional data.frame would suffice. The next step is to use a pipe to get a summary of the data frame. Right done!
Creating the ggplot2 graph
This should be easy for you to understand. This is going to be a basic scatter chart using geom_point() as the geometry. See hereunder:
ggplot_chart <- ggplot(data = df, aes(x = x, y = y)) + geom_point() + theme_bw()
I save this as a variable ggplot_chart and then create it as a point geometry and change the theme from the traditional ggplot2 grey backgrounded chart, there is probably a theme for this, but I don’t know the name.
This will create a basic chart – I will make sure the chart is reproducible and use set.seed(123) which forces R to reproduce the same random values. The chart looks like below:
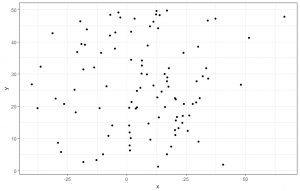
It is a little boring, but there is no need to jazz it up quite yet, as the purpose of this tutorial is to show you how to convert this chart to a plotly chart. This is covered in the next section.
“To plotly, or not to plotly, that is the question?”
You have done most of the leg work hitherto, all you need to do now is wrap the plot we created in a simple function wrapper:
#Convert to plotly
ggplotly(ggplot_chart)
Running this line will then present a chart that can now be interacted with:
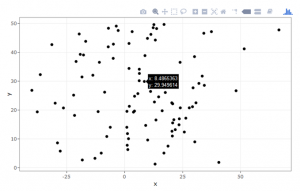
As you can see in the Viewer window there are now hover over tooltips, as well a toolbar on the top right hand side of the chart. These can then be explored and the user can do things like lasso select, compare similar data on hover, pan, scale, box select and create sub sets of the information.
If this does not work, it will, but in that rare instance that it doesn’t: