
Setting up the plot
The box plot, in ggplot2, can be really powerful and useful for analysing variation. I will show a few examples of different types of box plots in ggplot2.
Basic Box Plot
1 2 3 4 5 6 7 8 9 10 | library(ggplot2) theme_set(theme_classic()) # Plot plot <- ggplot(mpg, aes(class, cty)) plot + geom_boxplot(varwidth=T, fill="grey") + labs(title="Box plot", subtitle="City Mileage grouped by Class of vehicle", caption="Created by Gary Hutson", x="Vehicle Class", y="Mileage in the City") |
The plot placeholder has been created and we use the mtcars dataset and specify the class and cty variables of the data frame.
The geom_boxplot() geometry is used and the parameters insidde this are to force the boxes to be of varying widths and with a grey fill. The rest of the options are just chart labelling. The final output looks as below:
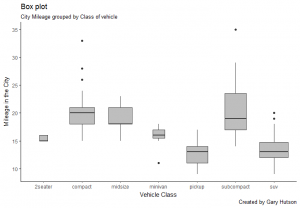
Formatted box plot
The only difference in the following code is the fill is forced to be one of the variables in the data frame and it colours the label according to the distinct values in that factor:
1 2 3 4 5 6 7 8 | plot <- ggplot(mpg, aes(class, cty)) plot + geom_boxplot(aes(fill=factor(cyl))) + theme(axis.text.x = element_text(angle=65, vjust=0.6)) + labs(title="Box plot", subtitle="City Mileage grouped by Class of vehicle", caption="Created by Gary Hutson", x="Vehicle Class", y="Mileage in the City") |
The chart outputted now looks like this:
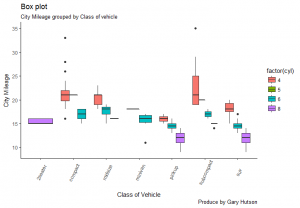
All that is different is the geom_boxplot(aes(fill=factor(cyl))) line has the fill set to a factor of the number of cylinders in the car.
Edward Tufte Box Plot
Tufte is considered one of the godfathers of data visulisation and comparison of visualisation methods. The code below shows how you can create a Tufte style box plot:
1 2 3 4 5 6 7 8 9 10 11 12 | install.packages("ggthemes") library(ggthemes) library(ggplot2) theme_set(theme_tufte()) # from ggthemes # plot plot <- ggplot(mpg, aes(manufacturer, cty)) plot + geom_tufteboxplot() + theme(axis.text.x = element_text(angle=65, vjust=0.6)) + labs(title="Tufte Box plot", caption="Produced by Gary Hutson", x="Class of Vehicle", y="City Mileage") |
The install.packages() command installs the ggthemes library, as the Tufte plot is not native to ggplot2. No parameters have been passed to the tufte theme. Most of the other items you should be familiar with when reading my other blog posts. The end result looks as below:

Personally, I prefer the native box plots over Tufte’s theme, but as I always say it is a mere case of personal preference.